Can You Map a Sense of Place?

Can You Map a Sense of Place?

The oldest recorded map in human history is from 6th Century Babylonia, but we have likely been using mental and depicted maps for much longer. Holding far more information than ‘x marks the spot’, maps have been critical to early civilizations finding and revisiting food sources, explorers sailing around the world, a landowner showing the extent of their land grant and in modern times, finding that new restaurant we want to try. Maps are an effort to define the landscape around us and put ourselves into that context while gaining a deeper understanding of the imprints we leave on the land. Maps have facilitated a “Sense of Place” long before the term was even coined.

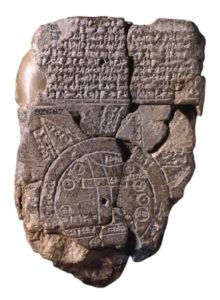
A “Sense of Place” has been defined as a strong identity that is deeply felt by inhabitants and visitors and often supports the protection and engagement with that place.

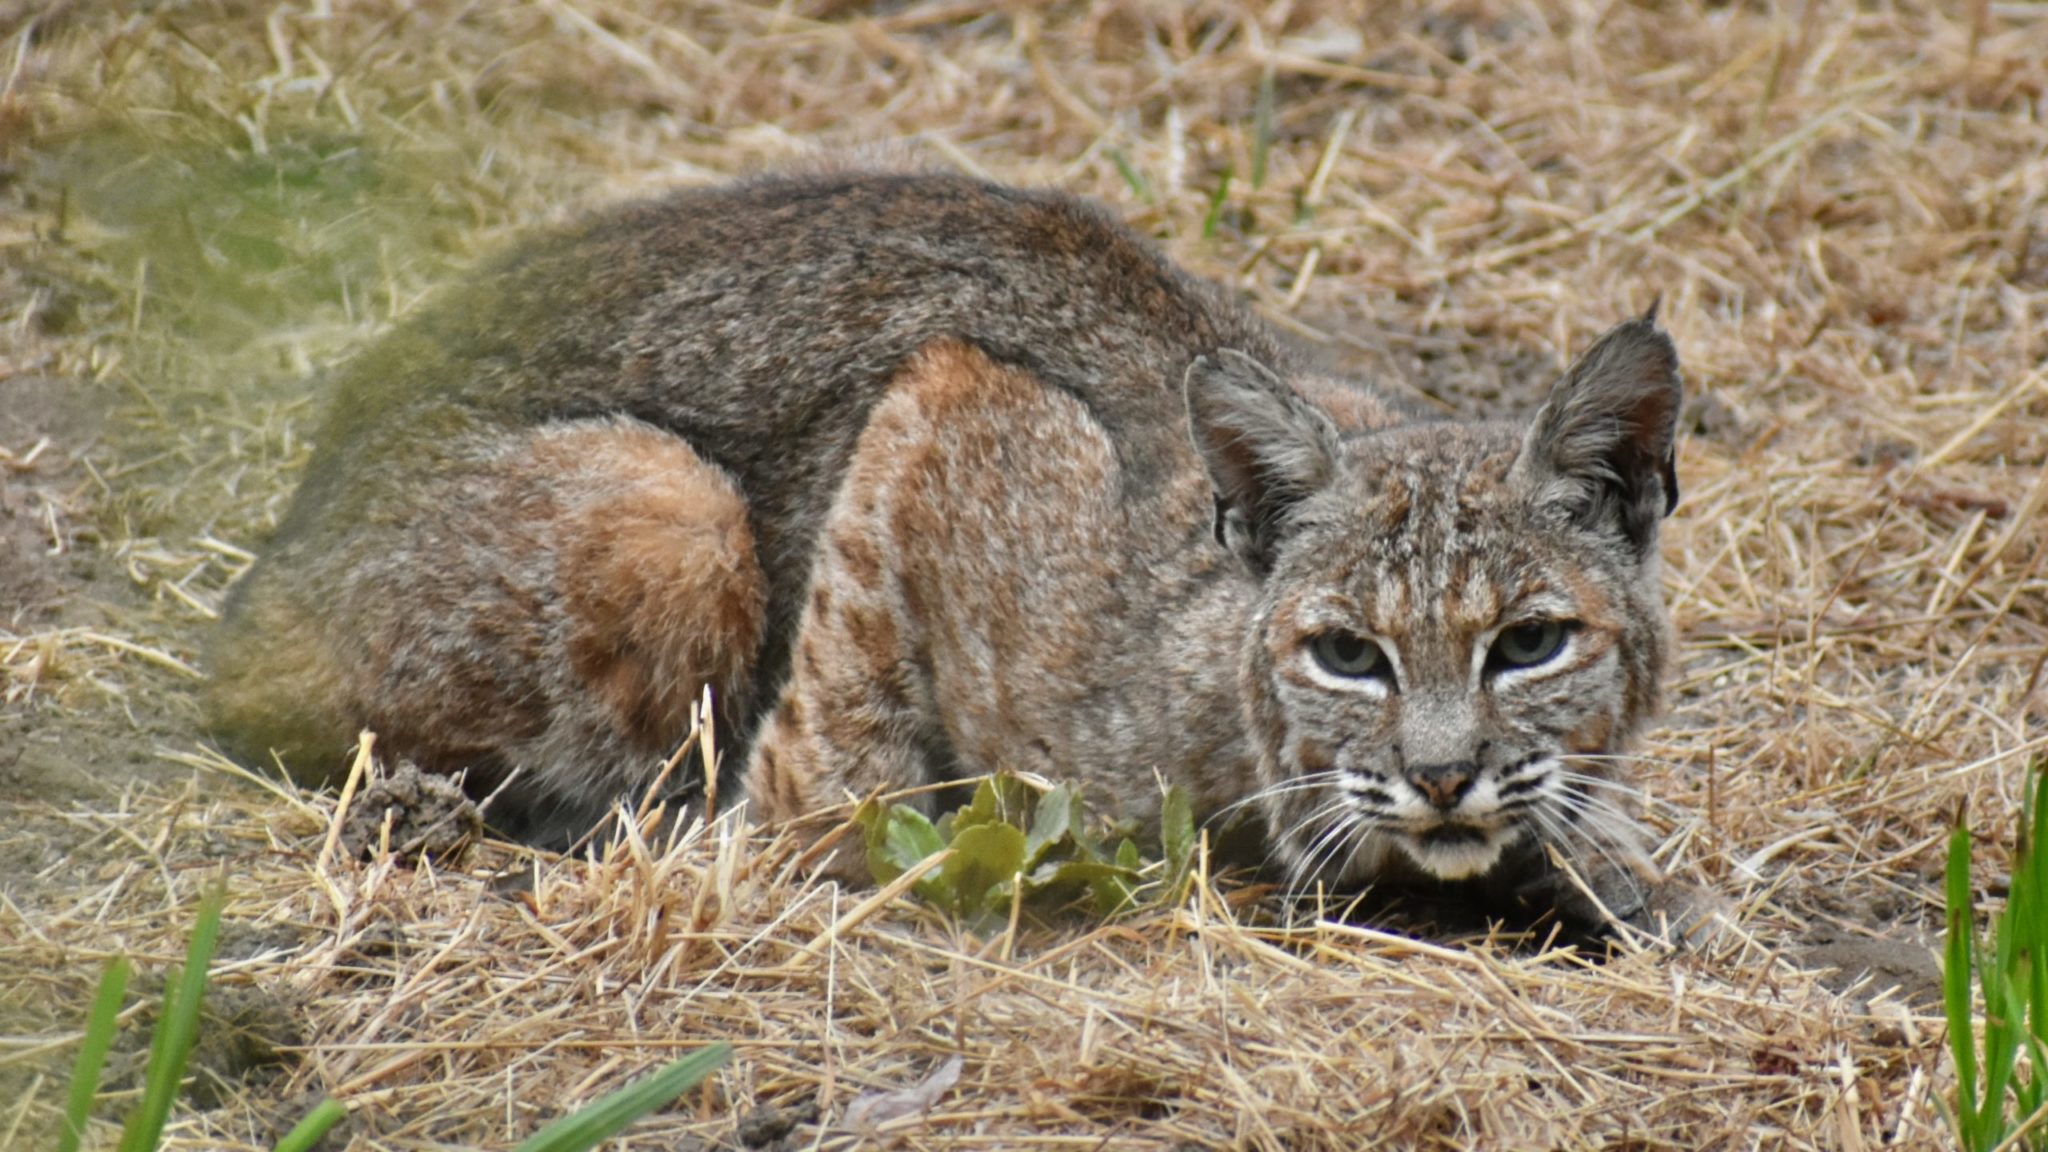
If you immediately thought of your connection and attachment to The Preserve, you are not alone. The Preserve, throughout its history, has drawn visitors and residents in with its sweeping vistas, splendid color pallet of grasslands and forests, and iconic wildlife populations. It was this deep Sense of Place that inspired the idea of a Conservation Community . In the early days of The Preserve that often indescribable sense was thoughtfully protected using imagery and maps. Layer by layer, the incredible complexity of Preserve lands were studied, mapped and assembled into a visual representation of The Preserve, which guided the future of the community’s design and construction.

Click to Enlarge Map

We continue to build on that early information about The Preserve, further discovering the “sense” as we study the “place” by updating our understanding of the plant communities, wildlife populations, fire risk and the gradual changes that occur with time. The power of this landscape information in our line of work is invaluable and is the foundation of nearly everything we do. Every day our work involves the use of maps and mapped data, representations of the reality on the ground, digital summaries of the beauty and diversity that we work to manage and support. Here are some examples of how we are using maps to inform and document our conservation work.

Conservation Grazing
When you have 5,200 acres of grasslands and limited staff and time resources, how do you prioritize where to focus those resources? First, we spend time in the field, observing, immersing and reading the land, steeping ourselves in the grasslands of The Preserve. Next we take our observations from the field and combine them with a detailed map of all

Click to Enlarge Map

the plant communities across The Preserve. Then we evaluate the grasslands by asking: Which ones have the highest diversity? Where do our grazing dependent wildlife (California tiger salamanders and burrowing owls) occur? Where have we not grazed recently that may need some grazing disturbance? Once we have identified our priorities we continue to move the cattle and evaluate how the grasslands look after grazing, while thinking about our next move.

Click to Enlarge Maps

Monitoring and Predicting Species on The Preserve
The Preserve is home to a stunning 900 species of plants and animals! Mapping, tracking and managing that diversity across 20,000 acres is no small feat. Technology aids us in mapping, predicting, finding and monitoring priority species that are Federally or State protected, at risk, support high biodiversity or are simply iconic to the area. Modeling, a form of artificial intelligence, is one tool we use by uploading the program with information about where we know the species is located and then the program compares habitat features like elevation, aspect, plant communities and even fog patterns to suggest other likely locations we could find the species.

Click to Enlarge Maps

We’ve used this technique to map the habitat of Smith’s blue butterfly, a delicate dime- sized butterfly that lives its whole life on buckwheat, a native brush species. We told the modeling program where we knew we had to streamline our monitoring efforts. Afterwards we are back on the land to check the accuracy of the predictions and look out for our little butterflies, tying the theoretical to reality on the ground.

Measuring Change
One of the most exciting advances to study, map and understand the lands of The Preserve is the recent acquisition of high-resolution aerial imagery. In October 2016 and again in April 2019 we collected imagery that is 4- inch resolution, allowing us to literally identify our favorite trees and corners of The Preserve! The 2016 imagery was collected after the Soberanes fire, showing the impacts and burned areas of The Preserve on a landscape of dormant golden grasslands. The 2019 imagery was collected at the height of the spring green, allowing for a nice contrast between the spring and fall and documenting the recovery from fire over the last three years.

Click to Enlarge Maps

Protecting the Intangibles


The idea of mapping, documenting and measuring the beauty of The Preserve may feel a little stripped down and awkward when paired with the emotional grounding we experience on the lands. But for the Conservancy staff the two are hand-in-hand. Our reverence for the diversity and color palate of our native grasslands drives us to understand how to protect them. Our fascination and enjoyment at watching a bobcat hunt along the edge of a trail feeds our need to document the bobcats today, so that we will be prepared to act if we notice something that threatens them tomorrow. The Sense of Place we have on The Preserve inspires and guides our science and land management, and in turn secures that experience for all others who spend time in this exquisite landscape.

BY CHRISTY WYCKOFF

CONTINUE READING DECEMBER’S NEWSLETTER